Is TDEE different for women?
The equation changes by one number for women: 166 kcal at rest. Far less than most assume, and less than picking the wrong activity level costs you.
By Hammad ShahidLast updated
Do women need a different TDEE calculator?
No, the same calculator works. Mifflin-St Jeor already accounts for sex with a single term: it subtracts 161 for women where it adds 5 for men, a difference of 166 kcal in resting metabolism before height, weight and age are considered. Everything after that, including the activity multiplier, is identical. The menstrual cycle moves scale weight by roughly half a kilogram of water at its peak, but it does not meaningfully change how many calories you burn.
Work out your own number first
The rest of this page explains what the equation does with your sex. It reads better once you have your own figure in front of you, so here is the same calculator that runs on the TDEE calculator page, with nothing different about it.
What does the equation actually change?
One term. Mifflin-St Jeor is the same calculation for everyone right up to the final constant, where it adds 5 for men and subtracts 161 for women:
BMR = (10 × weight in kg) + (6.25 × height in cm) − (5 × age) + 5 or − 161
So for two people who are otherwise identical, the gap is a flat 166 kcal at rest. Take a 32-year-old of 175 cm and 70 kg. A man gets 1,639 kcal. A woman gets 1,473. Scale both by a moderate activity factor of 1.55 and the day looks like this:
| Same height, weight and age | BMR | TDEE |
|---|---|---|
| Man | 1,639 | 2,540 |
| Woman | 1,473 | 2,283 |
A 257 kcal difference across the whole day. Real, worth having right, and considerably smaller than the gap most people assume exists.
Why is there a difference at all?
Mostly body composition, and the size of it can be worked out rather than asserted. Whole-body MRI of 468 adults put skeletal muscle at 38.4% of body mass in men and 30.6% in women. At 70 kg that is 26.9 kg of muscle against 21.4 kg, a difference of 5.5 kg.
Tissue does not all cost the same to keep. Skeletal muscle runs at about 13 kcal per kilogram per day at rest and fat tissue at about 4.5. So that 5.5 kg costs roughly 71 kcal a day as muscle and about 25 kcal as fat, a net difference of around 46 kcal.
Which is the interesting part: the muscle difference accounts for under a third of the 166 kcal constant, not all of it. The rest comes from organ mass, which is also larger in men on average and costs far more per kilogram than muscle does, and from whatever the equation absorbed that nobody has isolated. Anyone telling you the gap is simply muscle is rounding the explanation up.
That is also why the correction is a blunt constant rather than something clever. Mifflin-St Jeor is a population equation. It applies the average difference between two large groups, which means it will be wrong in both directions for individuals. A woman carrying more muscle than average is under-estimated by it; a man carrying less is over-estimated.
If you want the resting figure on its own, the BMR Calculator shows every step of the arithmetic, including which constant it applied and why.
Does the activity multiplier change?
No. The multipliers are identical, and that is correct rather than an oversight. The factor describes how much you move relative to your own resting rate, not an absolute amount of energy. A sedentary week is 1.2 of your BMR whoever you are.
Which means the biggest source of error is the same for everyone, and it is not the sex term. Choosing the wrong activity level moves the result by several hundred calories, far more than the 166 kcal the equation adjusts for. It is worth being deliberate about the activity level before worrying about anything else.
What does the menstrual cycle do to the number?
Less than the internet claims, and it affects the scale rather than the calculation. When 42 women were weighed twice a week through a full cycle, body weight during menstruation averaged 0.45 kg higher than during the first week of the cycle, and almost all of that increase was extracellular water rather than tissue.
Half a kilogram is measurable, and it is also well inside the ordinary day-to-day noise of a bathroom scale. It is not two or three kilograms, and it is not fat. The practical response is not to eat differently but to compare like with like: the same point in one cycle against the same point in the next, or simply a weekly average that absorbs it. See why your weight changes day to day for how to read the trend rather than the reading.
Energy expenditure does shift a little across the cycle, and the shift has a direction. Resting metabolic rate is slightly higher in the luteal phase, the roughly two weeks between ovulation and the next period, than in the follicular phase before ovulation. A 2020 meta-analysis pooling the published studies found the effect small but real.
Small is the important word. The difference is far smaller than the uncertainty already built into any TDEE estimate, and far smaller than the gap between two neighbouring activity levels. It is a good reason to compare resting measurements at the same point in the cycle, and not a reason to run two different calorie targets.
How many extra calories does pregnancy need?
Far fewer than “eating for two” implies, and the increase is not even across the nine months. Working from measured changes in metabolic rate and the energy laid down as tissue, the additional daily cost of a pregnancy with a 12 kg weight gain comes out as:
| Stage | Extra per day |
|---|---|
| First trimester | about 90 kcal |
| Second trimester | about 287 kcal |
| Third trimester | about 466 kcal |
The first trimester costs roughly a banana a day. Even the third is less than most people add.
There is a deeper finding worth knowing here. When total expenditure was measured by doubly labelled water across the life course and adjusted for fat-free mass, it stayed stable right through adulthood, including during pregnancy. In other words, pregnancy does not switch your metabolism to a different setting. It adds tissue, and tissue costs energy.
None of which makes a general calculator the right tool for a pregnancy target. These are population averages, and your own figure depends on your starting weight, how the pregnancy is progressing and your history. That belongs with a doctor or a registered dietitian.
How many extra calories does breastfeeding need?
More than pregnancy, which surprises people. Exclusive breastfeeding at an average milk production of 749 g a day costs about 626 kcal a day to produce.
The number you would actually add to a target is lower than that. In well-nourished women roughly 172 kcal a day comes from fat laid down during the pregnancy, so the net increase over pre-pregnancy needs is about 454 kcal a day. That subsidy is the mechanism behind postpartum weight loss, and it is also why aggressive dieting while breastfeeding tends to backfire: the deficit is already there.
Does your TDEE drop at menopause?
Less than the reputation suggests, and later than most people expect. The same doubly labelled water work found that expenditure adjusted for fat-free mass is stable from 20 to 60, and only declines in older adults after that. Menopause happens inside the stable window, not at the start of the decline.
What does change is the body the equation is applied to. Fat-free mass tends to fall across those years unless it is actively defended, and since resting metabolism tracks fat-free mass, the number follows it down. The drop is real. It is a body composition change with a metabolic consequence, rather than a switch that flips at a birthday.
The practical response is the same one that works at any age, and it is not eating less by default. Re-run the numbers, eat near them for three weeks, and let the scale tell you what your real maintenance level is now. Resistance training is the one intervention that acts on the thing actually changing.
What is a typical TDEE for a woman?
There is no single figure, because the equation is driven by your weight, height and age before activity is even considered. As a range, a woman who is moderately active most often lands somewhere between 1,950 and 2,200 kcal, and the same woman sitting at a desk all day lands nearer 1,550 to 1,700.
Every figure below comes from the same code as the TDEE calculator, so the table cannot drift away from the tool.
| Age | Height | Weight | BMR | Sedentary | Moderate | Very active |
|---|---|---|---|---|---|---|
| 25 | 160 cm | 60 kg | 1,314 | 1,577 | 2,037 | 2,267 |
| 25 | 165 cm | 65 kg | 1,395 | 1,674 | 2,163 | 2,407 |
| 30 | 160 cm | 60 kg | 1,289 | 1,547 | 1,998 | 2,224 |
| 30 | 165 cm | 70 kg | 1,420 | 1,704 | 2,201 | 2,450 |
| 35 | 170 cm | 65 kg | 1,377 | 1,652 | 2,134 | 2,374 |
| 40 | 165 cm | 70 kg | 1,370 | 1,644 | 2,124 | 2,364 |
| 45 | 160 cm | 65 kg | 1,264 | 1,517 | 1,959 | 2,180 |
| 50 | 165 cm | 70 kg | 1,320 | 1,584 | 2,046 | 2,277 |
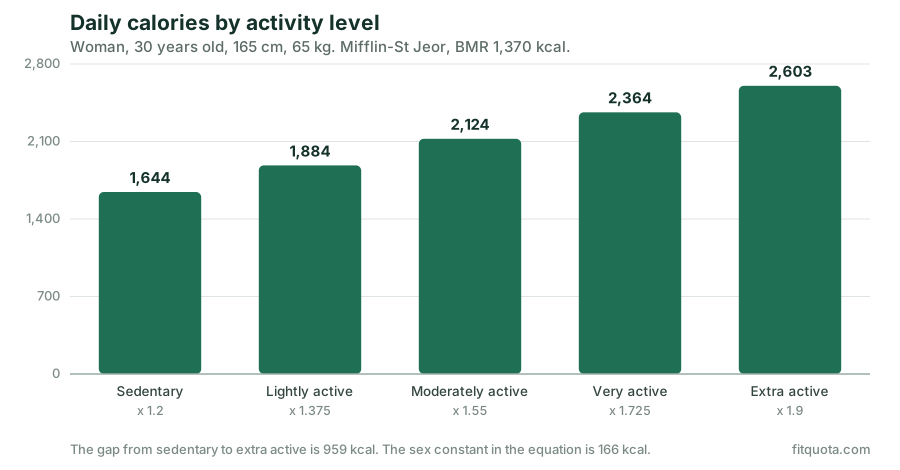
Read the columns before the rows. For the 40-year-old at 165 cm and 70 kg, moving from sedentary to very active adds 720 kcal, while the entire sex difference in the equation is 166 kcal at rest. The activity question is worth more than four times as much as the one everybody asks about.
So should I look for a women's TDEE calculator?
There is no need. Any calculator using Mifflin-St Jeor and asking for your sex is already doing the only adjustment the equation makes. A tool marketed specifically at women is running the same arithmetic behind different styling.
What matters far more is whether the calculator tells you what it did. The TDEE Calculator shows the equation, the constant it applied, the multiplier it used and the arithmetic between them, so you can see exactly which input moved your result rather than trusting a number that arrived without explanation.
Sources
The Mifflin-St Jeor equation and the population it was fitted to.
Mifflin MD, St Jeor ST, Hill LA, et al. A new predictive equation for resting energy expenditure in healthy individuals. Am J Clin Nutr. 1990;51(2):241–247.
View sourceThat body weight during menstruation averaged 0.45 kg higher than in the first week of the cycle, almost entirely from extracellular water, in 42 women weighed twice weekly.
Kanellakis S, Skoufas E, Simitsopoulou E, et al. Changes in body weight and body composition during the menstrual cycle. Am J Hum Biol. 2023;35(11):e23951.
View sourceThat resting metabolic rate is modestly but significantly higher in the luteal phase than the follicular phase, pooled across the published studies (effect size 0.33).
Benton MJ, Hutchins AM, Dawes JJ. Effect of menstrual cycle on resting metabolism: a systematic review and meta-analysis. PLoS One. 2020;15(7):e0236025.
View sourceThat whole-body MRI of 468 adults put skeletal muscle at 33.0 kg in men against 21.0 kg in women, and at 38.4% of body mass against 30.6%.
Janssen I, Heymsfield SB, Wang ZM, Ross R. Skeletal muscle mass and distribution in 468 men and women aged 18-88 yr. J Appl Physiol (1985). 2000;89(1):81-88.
View sourceThat the specific resting metabolic rate of skeletal muscle is about 13 kcal per kilogram per day and that of adipose tissue about 4.5, against 200 for liver and 440 for heart and kidneys.
Wang Z, Ying Z, Bosy-Westphal A, et al. Specific metabolic rates of major organs and tissues across adulthood. Am J Clin Nutr. 2010;92(6):1369-1377.
View sourceThat the extra daily energy cost of a pregnancy with a 12 kg weight gain is 375, 1200 and 1950 kJ per day across the three trimesters, and that exclusive breastfeeding costs 2.62 MJ per day, offset by about 0.72 MJ from tissue stores for a net 1.9 MJ.
Butte NF, King JC. Energy requirements during pregnancy and lactation. Public Health Nutr. 2005;8(7A):1010-1027.
View sourceThat energy expenditure adjusted for fat-free mass stays stable from roughly 20 to 60 years of age, including during pregnancy, and only declines in older adults. Measured by doubly labelled water across ages 8 days to 95 years.
Pontzer H, Yamada Y, Sagayama H, et al. Daily energy expenditure through the human life course. Science. 2021;373(6556):808-812.
View source
Run the numbers for yourself
This calculator estimates your TDEE, the total calories you burn in a typical day, by running Mifflin-St Jeor on your measurements and scaling it by an activity factor. If you are unsure which activity level fits, enter your daily step count and it suggests one. Add a body fat percentage and it also costs the same day from lean mass with Katch-McArdle, so you can see how far apart the two approaches are. Use it as a guide when planning nutrition rather than as a measurement.
Open the TDEE CalculatorRelated guides
Guide
BMR vs TDEE: what's the difference?
BMR is what you burn at complete rest; TDEE is your whole day. Which number to use for a calorie target, and why they are never the same.
Read guideTDEE Calculator
Guide
Why does your weight change so much day to day?
Water, glycogen, food in transit and salt move the scale far more than fat does. What a normal daily swing looks like, and how to read the number properly.
Read guideCalorie Calculator